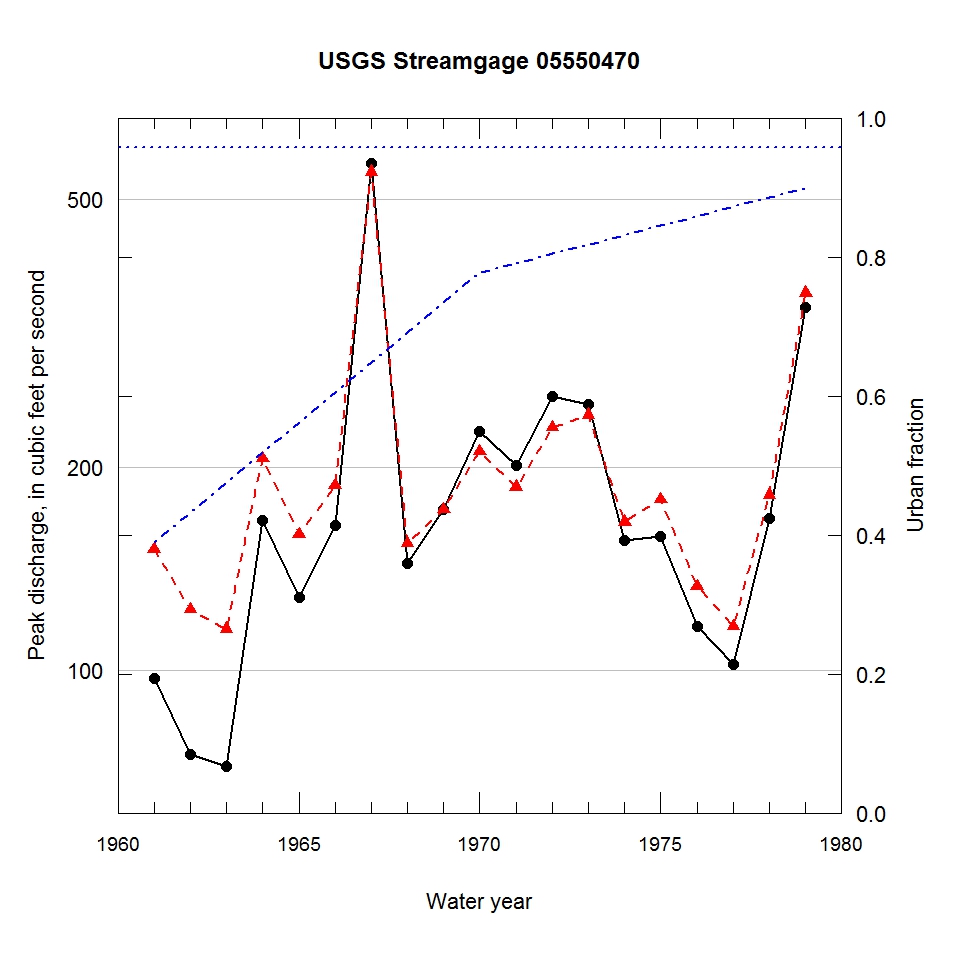
Observed and urbanization-adjusted annual maximum peak discharge and associated urban fraction and precipitation values at USGS streamgage:
05550470 POPLAR CREEK TRIBUTARY NEAR BARTLETT, IL


| Water year | Segment | Discharge code | Cumulative reservoir storage (acre-feet) | Urban fraction | Precipitation (inches) | Observed peak discharge (ft3/s) | Adjusted peak discharge (ft3/s) | Exceedance probability |
| 1961 | 1 | -- | 0 | 0.389 | 1.304 | 97 | 151 | 0.688 |
| 1962 | 1 | -- | 0 | 0.433 | 0.274 | 75 | 123 | 0.845 |
| 1963 | 1 | -- | 0 | 0.476 | 1.214 | 72 | 115 | 0.883 |
| 1964 | 1 | -- | 0 | 0.519 | 1.760 | 167 | 206 | 0.375 |
| 1965 | 1 | -- | 0 | 0.562 | 0.577 | 128 | 159 | 0.639 |
| 1966 | 1 | -- | 0 | 0.605 | 1.295 | 164 | 188 | 0.473 |
| 1967 | 1 | -- | 0 | 0.648 | 1.192 | 565 | 549 | 0.013 |
| 1968 | 1 | -- | 0 | 0.691 | 1.573 | 144 | 154 | 0.671 |
| 1969 | 1 | -- | 0 | 0.735 | 0.808 | 173 | 173 | 0.554 |
| 1970 | 1 | -- | 0 | 0.778 | 1.495 | 226 | 211 | 0.344 |
| 1971 | 1 | -- | 0 | 0.791 | 0.226 | 201 | 187 | 0.477 |
| 1972 | 1 | -- | 0 | 0.805 | 1.361 | 255 | 229 | 0.254 |
| 1973 | 0 | -- | 77 | 0.818 | 1.349 | 248 | 239 | 0.224 |
| 1974 | 0 | -- | 154 | 0.832 | 0.624 | 156 | 166 | 0.594 |
| 1975 | 2 | -- | 154 | 0.845 | 0.824 | 158 | 179 | 0.520 |
| 1976 | 2 | -- | 154 | 0.859 | 1.299 | 116 | 133 | 0.796 |
| 1977 | 2 | -- | 154 | 0.872 | 0.868 | 102 | 116 | 0.881 |
| 1978 | 2 | -- | 154 | 0.886 | 1.385 | 168 | 182 | 0.505 |
| 1979 | 2 | -- | 154 | 0.899 | 0.316 | 346 | 363 | 0.048 |

